
The 184-Country Trade Ledger: Evaluating U.S. Import-Export Dynamics Under Current Tariffs
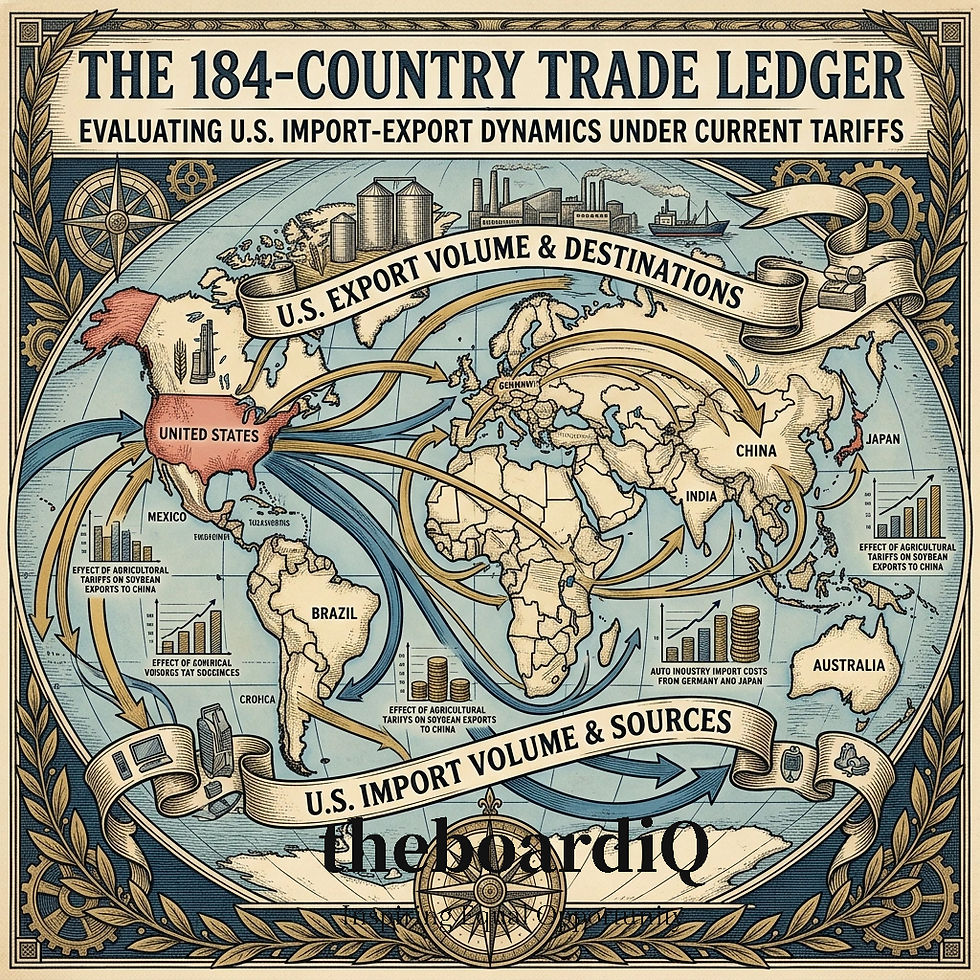
Data drawn from the United States Census Bureau.
NOTE: All figures are in millions of U.S. dollars on a nominal basis, not seasonally adjusted unless otherwise specified. Details may not equal totals due to rounding. Table reflects only those months for which there was trade.
For individual country blueprints, please continue to access theboardiQ Tariffs Dashboard
Executive Overview
The implementation of widespread tariff measures across 184 trading partners has drastically shifted bilateral trade flows, prompting a divergence between historical supply chains and current import-export volumes. This report captures the comprehensive Calendar Year (CY) and Year-to-Date (YTD) performance of U.S. goods and services, evaluating how shifting tariff barriers have altered market access, redirected trade through intermediary economies, and influenced domestic pricing structures.
Key Takeaways & Metrics
This executive commentary presents an analysis of the US Trade Balance Trend across international trading partners, focusing on the top 10 negative outliers (countries where the trade balance deteriorated most sharply) and top 10 positive outliers (countries where the trade balance improved most significantly).
Balance Trend (Annualized YTD vs CY) is calculated using the underlying formula.measuring the percentage change or directional trend of the Annualized Year-To-Date (YTD) Trade Balance relative to the prior full Calendar Year (CY) Trade Balance.
To compare YTD figures (which cover 8 months of trade data available, from January through August 2026) against a full 12-month Calendar Year in 2025, the YTD balance is annualized using a factor of 1.5.

Macro Trade Overview & National Impact
An analysis of bilateral trade flows across 184 nations reveals a net positive impact on the US economy, characterized by a structural narrowing of the national trade deficit.
Prior Calendar Year (CY) US Net Trade Balance: -$1,257.38 Billion (-$1,257,377.50 Million), comprising $2,140.58 Billion in exports and $3,401.96 Billion in imports.
Year-To-Date (YTD 8-Month) US Net Trade Balance: -$755.21 Billion (-$755,208.70 Million), comprising $1,483.44 Billion in exports and $2,239.05 Billion in imports across $3,722.50 Billion in total trade volume.
Annualized YTD US Net Trade Balance: -$1,132.81 Billion (-$1,132,813.05 Million).
Net Overall US Economic Dollar Impact: +$124.56 Billion (+$124,564.45 Million) in net trade balance improvement, representing a 9.91% reduction in the US national trade deficit relative to the prior calendar year.
Tariff Framework: The overall weighted average tariff rate applied across import volumes stands at 10.98%, with a simple average tariff rate of 10.1% across trading partners.
Key Takeaways:
1. Broad Rebalancing: Positive Bilateral Gains Outpace Deteriorations Worldwide
Distribution of Gains: Among the 184 evaluated nations, 100 countries demonstrated positive trade balance improvements for the US economy, generating a total positive shift of +$409.82 Billion (+$409,815.05 Million).
Distribution of Losses: Conversely, 81 countries registered trade balance deteriorations totaling -$285.25 Billion (-$285,250.60 Million), while 2 nations recorded zero net change.
Net Deficit Reduction: Combining all 183 nations, the US economy realized a net gain of +$124.56 Billion, trimming the overall annualized trade deficit from -$1.257 Trillion to -$1.133 Trillion.
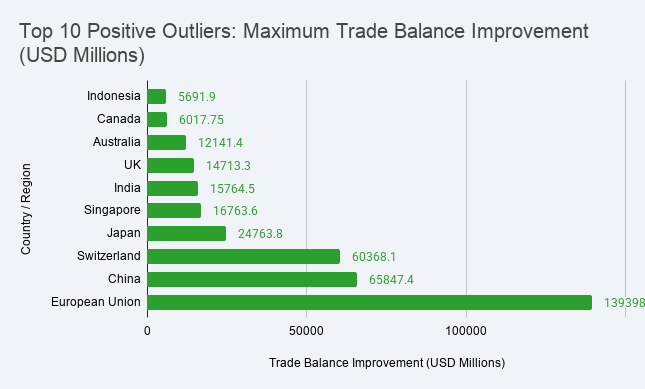
2. Top 10 Positive Outliers Account for 88.2% of Total Trade Balance Gains
The top 10 positive outliers delivered a combined trade balance improvement of +$361.47 Billion (+$361,469.75 Million), representing 88.20% of all trade balance gains achieved across the 100 positive trading partners. As displayed in the chart titled Top 10 Positive Outliers: Maximum Trade Balance Improvement (USD Millions), these key partner implications include:
European Union: +$139,398.00 Million (+$139.40 Billion) improvement - The single largest positive contribution, driving down the US trade deficit with the EU from -$220.35 Billion in CY to an annualized - $80.95 Billion YTD (a 63.3% deficit reduction under a 10.0% tariff).
China: +$65,847.40 Million (+$65.85 Billion) improvement - Reduced the US-China trade deficit from -$202.67 Billion in CY to an annualized -$136.83 Billion YTD under a 24.0% revised tariff rate.
Switzerland: +$60,368.10 Million (+$60.37 Billion) improvement -Flipped from a -$32.49 Billion deficit in CY to an annualized surplus of +$27.88 Billion YTD.
Japan: +$24,763.80 Million (+$24.76 Billion) improvement - Narrowed the US deficit with Japan from -$64.45 Billion to -$39.68 Billion annualized.
Singapore: +$16,763.60 Million (+$16.76 Billion) improvement -Expanded the US trade surplus with Singapore from +$3.41 Billion in CY to +$20.17 Billion annualized.
India: +$15,764.50 Million (+$15.76 Billion) improvement - Reduced the trade deficit with India from -$58.42 Billion to -$42.66 Billion annualized.
United Kingdom: +$14,713.30 Million (+$14.71 Billion) improvement - Expanded the US trade surplus with the UK from +$32.61 Billion to +$47.32 Billion annualized.
Australia: +$12,141.40 Million (+$12.14 Billion) improvement -Increased the US trade surplus with Australia from +$4.75 Billion to +$16.89 Billion annualized.
Canada: +$6,017.75 Million (+$6.02 Billion) improvement - Trimmed the bilateral deficit with Canada from -$48.30 Billion to -$42.28 Billion annualized under a 10.0% tariff.
Indonesia: +$5,691.90 Million (+$5.69 Billion) improvement - Narrowed the bilateral deficit from -$23.80 Billion to -$18.11 Billion annualized.

3. Top 10 Negative Outliers Account for 96.5% of Total Trade Balance Deterioration
The top 10 negative outliers registered a combined trade balance deterioration of -$275.13 Billion (-$275,133.45 Million), representing 96.45% of all negative trade balance shifts across the 81 deteriorating partners. As shown in the chart titled Top 10 Negative Outliers: Maximum Trade Balance Deterioration (USD Millions), these trade balance deteriorations reflect supply chain re-routing and import substitution:
Taiwan: -$74,888.50 Million (-$74.89 Billion) deterioration - The largest negative impact, expanding the US trade deficit with Taiwan from -$146.61 Billion in CY to - $221.50 Billion annualized YTD (a 51.1% deficit expansion driven by semiconductor and technology imports).
Vietnam: -$67,580.00 Million (-$67.58 Billion) deterioration -Increased the bilateral trade deficit from - $178.28 Billion in CY to -$245.86 Billion annualized YTD due to redirected Asian manufacturing flows.
Thailand: -$41,825.70 Million (-$41.83 Billion) deterioration -Widened the US deficit with Thailand from -$71.67 Billion to -$113.49 Billion annualized.
Mexico: -$36,773.50 Million (-$36.77 Billion) deterioration - Expanded the US trade deficit with Mexico from -$197.03 Billion in CY to -$233.81 Billion annualized YTD, making Mexico the largest single trade partner by total volume ($682.82 Billion YTD).
South Korea: -$26,106.50 Million (-$26.11 Billion) deterioration -Expanded the trade deficit from -$56.48 Billion in CY to -$82.58 Billion annualized.
Malaysia: -$9,503.20 Million (-$9.50 Billion) deterioration - Increased the bilateral trade deficit from -$30.84 Billion to -$40.34 Billion annualized.
Venezuela: -$8,021.55 Million (-$8.02 Billion) deterioration - Expanded the deficit from -$0.72 Billion to -$8.74 Billion annualized.
Philippines: -$7,849.55 Million (-$7.85 Billion) deterioration - Increased the deficit from -$8.52 Billion to -$16.37 Billion annualized.
United Arab Emirates: -$1,393.30 Million (-$1.39 Billion) deterioration - Contracted the US bilateral trade surplus from +$23.76 Billion in CY to +$22.36 Billion annualized.
Guyana: -$1,191.65 Million (-$1.19 Billion) deterioration - Widened the trade deficit from -$3.58 Billion to -$4.77 Billion annualized.
4.High Trade Volume Concentration Among Top 10 Partners
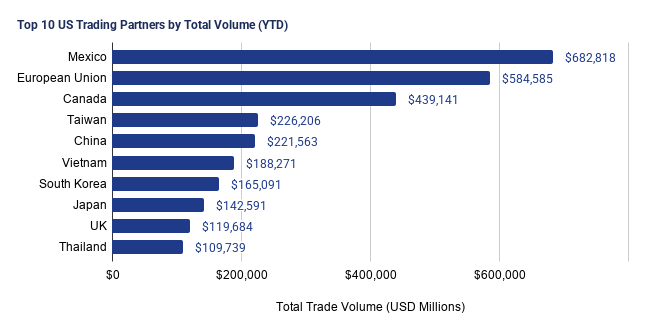
The vast majority of US trade flow is concentrated among a small group of strategic trading partners, dominated by North American neighbors and the European Union.
Top 10 Trade Volume Share: The top 10 partners generate $2,879,690 million ($2.88 trillion), representing 77.4% of total US Year-To-Date (YTD) bilateral trade volume ($3,722,496 million).
North American & EU Dominance: Mexico ($682,818M total YTD volume), the European Union ($584,585M), and Canada ($439,141M) jointly account for $1,706,544 million ($1.71 trillion) or 45.8% of all US trade volume.
Import Dependency: In total, the US imported $2,239,052 million ($2.24 trillion) YTD compared to $1,483,443 million ($1.48 trillion) in exports, resulting in a net YTD trade balance deficit of -$755,209 million (-$755.2 billion).

5.Asymmetric Deficit Drivers vs. Surplus Outliers
The overall US trade deficit is heavily concentrated in Southeast Asian manufacturing hubs, East Asian partners, and Mexico, while surplus opportunities remain limited to a few specific trade relationships.
Leading Trade Deficit Partners: Vietnam represents the largest YTD deficit at -$163,904 million (imports of $176,088M against exports of only $12,184M), followed closely by Mexico (-$155,871 million), Taiwan (-$147,665 million), China (-$91,218 million), and Thailand (-$75,662 million).
Extreme Export-to-Import Disparities: US exports cover only 6.9% of imports from Vietnam ($12.18B vs $176.09B) and 18.4% of imports from Thailand ($17.04B vs $92.70B).
Top Trade Surplus Outliers: The United Kingdom provides the largest net trade surplus for the US at +$31,549 million YTD ($75,616M exports vs $44,068M imports), followed by Switzerland (+$18,584 million), the United Arab Emirates (+$14,908 million), Singapore (+$13,447 million), and Brazil (+$11,527 million).
Concluding Summary
Macroeconomic Takeaway: Deficit Contraction & Momentum
The latest trade performance data demonstrates tangible progress in rebalancing the US trade position, driven by strategic tariff recalibrations and bilateral trade shifts:
Substantial Deficit Reduction: On an annualized basis, the US net trade deficit is projected to contract from -$1,257.38B in the prior calendar year to -$1,132.81B—a net positive economic swing of +$124.56B (or +9.91%).
Export Resiliency: Year-to-date (8-month) export run-rates ($1,483.44B) remain robust across a total volume of $3,722.50B, signaling that strategic tariff adjustments have reduced net import leakage without triggering broad-based reciprocal export contraction.
Bilateral Winners vs. Pressure Points:
Major Improvements: Significant deficit contractions with core partners including the European Union (+63.3% balance improvement), China (+32.5%), and Canada (+12.5%) account for the bulk of the headline gains.
Widening Deficits: Deficits widened with Taiwan (-51.1%), Vietnam (-37.9%), and Mexico (-18.7%), reflecting supply chain redirection, transshipment substitution, and critical tech component dependencies (notably semiconductors and advanced electronics).
Strategic Focus Areas for the US
1. Close Transshipment & Rules-of-Origin Loopholes
Challenge: While direct trade deficits with China contracted by over 32%, deficits with Vietnam and Mexico expanded, indicating that supply chains are routing around bilateral tariffs rather than fully reshoring.
Action: Tighten Rules of Origin (ROO) definitions and regional value-content thresholds under USMCA and regional trade frameworks to prevent third-party tariff evasion and pass-through assembly.
2. Supercharge High-Value Strategic Exports
Challenge: US trade balance improvements to date have been primarily import-compression driven rather than export-led.
Action: Expand targeted export financing, commercial diplomacy, and regulatory fast-tracking for high-margin, innovation-driven sectors where the US holds structural moats: liquefied natural gas (LNG), aerospace, AI enterprise infrastructure, agricultural technology, and defense systems.
3. Address Critical High-Tech Import Dependencies
Challenge: The sharp deterioration in the trade balance with Taiwan underscores ongoing domestic exposure to offshore advanced logic semiconductors and computing hardware.
Action: Accelerate domestic fabrication capacity timelines and nearshore advanced packaging in trusted allied jurisdictions to mitigate supply-chain vulnerability and reduce structural import volume.
4. Pursue Reciprocal Tariff Harmonization
Challenge: Several key trading partners continue to maintain average effective tariff rates substantially higher than the US baseline.
Action: Use current tariff leverage to negotiate targeted bilateral barrier reductions, pressing trading partners to lower tariff and non-tariff barriers on American industrial and agricultural goods.
5. Capitalize on Services & IP Export Dominance
Challenge: Goods deficits continue to overshadow the United States’ premier competitive advantage: intellectual property, digital services, and financial technology.
Action: Integrate digital trade chapters and intellectual property enforcement standards into all bilateral frameworks to maximize high-margin digital and services surpluses that offset physical merchandise deficits.


Comments